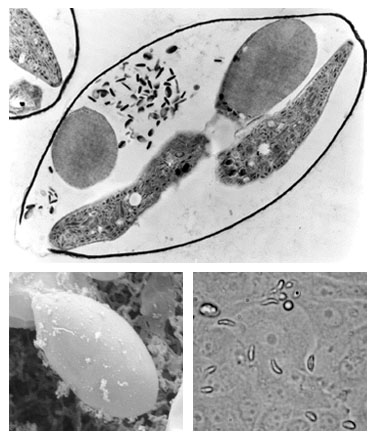
The Eimeria Transcript Database (Eimeria TDB) is an integrated resource of cDNA sequencing and annotation data of Eimeria spp. of domestic fowl. In addition to sequencing data, Eimeria TDB provides an organized catalogue of functionally annotated reconstructed transcripts. The Eimeria TDB is maintained by the Coccidia Molecular Biology Research Group at the Institute of Biomedical Sciences, University of São Paulo, Brazil. Photos: Transmission electron micrograph of Eimeria sporocyst (upper picture); Scanning electron micrograph of sporocyst (lower left); Sporozoites invading in vitro cultured cells (lower right). |
Search assembled cDNAs using keywords and evidence types
Eimeria acervulina
Expansible tree
Table of ontologies
Eimeria maxima
Expansible tree
Table of ontologies
Eimeria tenella
Expansible tree
Table of ontologies
*NOTE: Please use Mozilla Firefox, Safari or Opera browser to visualize the expansible trees. If you are using Internet Explorer, please use the links to "Table of ontologies" to visualize the results.
| Eimeria acervulina | ||
| Feature table | Extended Feature table | GFF3 |
| Eimeria maxima | ||
| Feature table | Extended Feature table | GFF3 |
| Eimeria tenella | ||
| Feature table | Extended Feature table | GFF3 |
| Eimeria acervulina | ||
| Assembled cDNAs | cDNA with ORFs > 50 aa | |
| Eimeria maxima | ||
| Assembled cDNAs | cDNA with ORFs > 50 aa | |
| Eimeria tenella | ||
| Assembled cDNAs | cDNA with ORFs > 50 aa | |
| Eimeria acervulina | ||
| cDNA products | ||
| Eimeria maxima | ||
| cDNA products | ||
| Eimeria tenella | ||
| cDNA products | ||
If you have any question or would like to communicate any error, please contact us:
1. Introduction Back to table of contents
In the case of E. tenella, we reconstructed the cDNAs using a mixture of ORESTES (USP) and EST reads (Sanger + WashU + UKM + USDA), totaling around 48,000 sequences. For E. acervulina and E. maxima, assemblies were obtained using only ORESTES reads produced in our laboratory. All reads were submitted to a pre-processing pipeline constructed with EGene platform. The pipeline included vector and primer masking, end trimming, quality filtering, size filtering, contaminant screening and removal, and DNA assembly. The assembled sequences were submitted to an annotation pipeline constructed with EGene2, a new version of the platform that includes annotation components (available upon request). The pipeline consisted in finding all potential ORFs >50 aa, translating the products and searching for sequence similarity (BLAST versus nr), protein domains (RPS-BLAST versus CDD), protein motifs (InterProScan versus a set of databases), transmembrane domains (TMHMM and Phobius), signal peptide (SignalP and Phobius), and GPI anchoring cleavage site (DGPI). Finally, using InterPro IDs, we mapped and quantified GO terms using a GO Slim file. KOG orthology mapping and KEGG mapping were also performed with EGene2 components.
2. BLAST Back to table of contents
A BLAST service is available and searches can be performed against several Eimeria databases, including genomic, cDNA and mitochondrial sequences. Genomic sequences comprise shotgun reads and several assembly versions from the Sanger Institute. Expressed sequences include assembled cDNAs of E. tenella, E. acervulina and E. maxima. E. tenella the database contains an assembly made from a mixture of ORESTES and EST reads (Sanger + WashU + UKM + USDA). For E. acervulina and E. maxima, assemblies were obtained using only ORESTES reads. Databases of translated products from the assembled cDNAs are also offered, including ORFs longer than 50 and 100 amino acids respectively. Finally, a database of mitochondrial genomes of the seven Eimeria species that infect the domestic fowl is also available. All programs of BLAST package can be used: blastn, blastp, blastx, tblastx and tblastn. Once a given assembled cDNA hit is identified, the user can consult the relational database to inspect the corresponding annotation using the sequence ID.
3. Search database Back to table of contents
This page allows performing queries to the Eimeria Transcript Database. The database integrates data from the three Eimeria species, and results from all programs used to collect evidence.
3.1. Enter Sequence ID or Keyword. Back to table of contents
If the user already knows the sequence ID, then the corresponding annotation can be directly retrieved. For instance, Eten_0009 is a valid ID of an E. tenella sequence. Please note that if the search is restricted to another Eimeria species (see “Restricting search” section, 3.2), then no results will be presented.
The user can also enter any keyword to perform the search. Valid keywords:
3.2. Restricting searches. Back to table of contents
Three radio button lists are provided to permit different kinds of search restrictions.
3.2.1. According to species. Back to table of contents
Using a radio button list one can restrict the search to a particular Eimeria species (Default=all organisms).
3.2.2. According to search mode. Back to table of contents
When performing a search using sequence IDs (see section 3.1), one must choose the option "Find sequenceID"), otherwise no results will be presented.
When using different query terms, the search can be restricted to results presenting all query terms of to any of the terms.
For instance, if one selects serine protease in all organisms, choosing the option “Find one of the query terms”, the database will report 365 sequences. Alternatively, if one chooses the option “Find all query terms”, the database will report 287 sequences found for the first term (serine) and 111 sequences for the second term (protease). Since not all products containing serine in their name are proteases (e.g. serine protein kinases), nor all proteases are serine proteases, the database will only report 33 sequences annotated as serine proteases.
3.2.3. According to evidence. Back to table of contents
In addition to the search limits described above, the user can still restrict the search to sequences presenting a given set of analysis results. In the former example (find all query terms for serine protease in all organisms), if one chooses to restrict the search to sequences that contain protein motifs identified on InterPro, and proteins mapped on KEGG, the database will report only 6 sequences fulfilling these criteria.
3.3. Annotation pages. Back to table of contents
As a result of the query, the user obtains a list sequences fulfilling the search criteria. Each sequence contains a link redirecting to the respective annotation page. Each page contains information on the sequence itself and corresponding annotation evidence and reports. Also, when available, orthology across apicomplexan parasites and expression data are provided.
3.3.1. Sequences. Back to table of contents
This section contains links to the assembled cDNAs sequence, coding region and respective amino acid product. All sequences are available for download in FASTA format.
3.3.2. Annotation. Back to table of contents
Each assembled cDNA sequence should only code for a single product, implying that only one ORF must be chosen for annotation purposes. Automated annotation programs usually determine ORFs using a combination of gene prediction software. In our case, we determined all potential ORFs coding for products longer than 50 aa, and analyzed the proteins in regard to sequence similarity, protein domains and motifs. We established an evidence-based automated decision system that selects the most probable ORF. This process takes into account the presence of similar orthologs, proteins motifs, length of the ORF, amongst other criteria. We provide a full annotation of all ORFs (without ORF selection) as well as the annotation of the specific selected ORF.)
Annotation is provided in three distinct formats: Feature Table (FT), extended FT and GFF3. Feature Table is the format adopted by the major sequence repositories such as GenBank, EMBL and DDBJ, and is composed of feature keys and qualifiers. We also provide an extended FT version, which includes some specific tags that are not officially permitted by the FT specification, but are compatible with Artemis annotation and editing tool. These tags include feature colors, labels, etc., and allow for a better and easier visualization. GFF3 is the Generic Feature Format, a recently implemented format for annotation interchange. A typical GFF3 file consists of 9 tab-separated columns and is compatible with Sequence Ontology.
3.3.3. Orthologs/Paralogs within Apicomplexa. Back to table of contents
We incremented the annotation of transcriptome products of the three Eimeria species by performing an integrated orthology analysis with data sets of proteins predicted from the genomes of six apicomplexan parasites:Toxoplasma gondii, Plasmodium falciparum, Neospora caninum, Babesia bovis, Theileria annulata and Cryptosporidium parvum. Each proteome data set was firstly submitted to a functional classification using a local implementation of KOG algorithm. To identify pairs of orthologous proteins across the different apicomplexans, we carried out an all-against-all comparison of the translated products of the nine organisms (6 apicomplexans plus 3 Eimeria species) using InParanoid (Remm et al, 2001; Ostlund et al., 2010), in a total of 36 paired analyses. Next, we merged all pairwise ortholog clusters identified by Inparanoid into multi-species clusters using MultiParanoid (Alexeyenko et al, 2006). The table provided in the annotation page of each sequence lists all the corresponding orthologs identified in apicomplexan parasites. Orthologs of other Eimeria species are cross-referenced through links to the respective annotation page.
3.3.4. Gene expression profile. Back to table of contents
When available, we provide a chart displaying the expression profile of the gene across different developmental stages. Expression data is based on countings of the number of reads composing each assembled sequence according to their respective source (developmental stage). The corresponding p-value and status of expression (differentiated/non-differentiated) are also displayed.
3.3.5. Evidence. Back to table of contents
In this section, we provide links for all program results that contain evidence to support a function for the putative gene. Results are available for the following programs: BLAST, RPS-BLAST, InterproScan, SignalP, TMHMM, Phobius, and DGPI. Also, links for mapped GO terms, functional classification using KOG and eggNOG databases, and pathway mapping on KEGG are also available.
Our annotation pipeline has automated selected the most probable coding ORF, based on a set of anaysis results. However, if the user wants to inspect the evidence for all other ORFs, we provide a link entitled “Evidence for all predicted ORFs” at the bottom of the annotation page. Links to evidence for all ORFs are conveniently grouped in a table.
4. Global analyses Back to table of contents
This section provides both qualitative and quantitative analyses for the whole set of translated products of E. acervulina, E. maxima and E. tenella. Analyses include Gene Ontology (GO) term mapping, orthology functional classification using KOG and eggNOG databases and pathway mapping using KEGG.
4.1. GO Term Mapping. Back to table of contents
We have mapped all GO terms found, and quantified the distribution of these terms using a GO Slim file. The results are presented in two distinct formats: expansible trees and tables.
4.1.1. Expansible trees. Back to table of contents
Each expansible/collapsible tree is in fact composed of a set of three trees, each one corresponding to an ontology domain. By clicking on the left plus and minus signs, the branches can be expanded or collapsed, respectively. If the user clicks on the GO term itself, then the page is redirected to the Amigo browser, showing the corresponding term description. Just on the right of the GO terms, there are links to all sequences whose products have been mapped to this GO term. The list of sequence is then followed by links to the corresponding nucleotide and protein sequences. Also, links to GO terms display all GO terms mapped to the sequence. Note: this format can only be used on Mozilla Firefox, Safari or Opera browsers, since the XML files are not compatible with MS Internet Explorer. For this latter browser we provide another data format, using conventional HTML tables (see below).
4.1.2. Table of ontologies. Back to table of contents
An alternative for MS Internet Explorer users to visualize the data is to click on the table of ontologies link. In this case, instead of a hierarchical tree, a typical HTML table will be displayed. The information content, however, is exactly the same as described above, but without the hierarchical view.
4.2. KOG - euKaryotic clusters of Orthologous Groups. Back to table of contents
We have mapped all reconstructed transcript sequences onto KOG database. A table displays KOG (Tatusov et al., 2003) functional categories and the respective number of sequences classified in each category. A pie chart also depicts the same information. By clicking on the one-letter KOG code of the table, the user gets access to a page displaying a list of all proteins classified in this specific category. BLAST alignments and a link to the corresponding functional category information on KOG site are also provided.
4.3. eggNOG - evolutionary genealogy of genes: Non-supervised Orthologous Groups. Back to table of contents
We have mapped all reconstructed transcript sequences into eggNOG v2.0 database, a much more comprehensive and enriched database of orthologous groups, constructed from data of 630 organisms (Muller et al., 2010). Data organization follows the same structure as described above for KOG (see former section).
4.4. KEGG Pathways. Back to table of contents
We mapped the translated protein sequences onto KEGG Orthology (Aoki-Kinoshita & Kanehisa, 2007) database. Using the identified KEGG Orthology entries (KOs), we mapped the corresponding metabolic pathways. The KEGG Pathway classes are listed on a table and the respective sequence counts classified in each class are presented. A pie chart also depicts the KEGG category distribution. By clicking on a KEGG Pathway Class link, an expanded list of subclasses is displayed. Each subclass presents the corresponding number of classified sequences and contains a link that opens up a page with the list of proteins (with links to BLAST alignments), Class Pathway IDs, KO descriptions, E.C. numbers and KEGG pathways. Each pathway link redirects to a page presenting a graphical representation of the corresponding pathway, as generated by KEGG. The protein corresponding to the mapped query protein is displayed in a red-labeled box.
5. Downloads Back to table of contents
In this section the user can download annotation files, as well as nucleotide and amino acid sequences. Data is provided for each one of the three Eimeria species.
5.1. Annotation files. Back to table of contents
Annotation files of each Eimeria species are available for download in the following formats: Feature Table, Extended Feature Table (includes some Artemis-compatible feature keys and qualifiers) and GFF3. Annotation data is provided in compressed zip files. Each file contains the annotation of the whole set of reconstructed cDNAs of each Eimeria species.
5.2. Nucleotide sequences. Back to table of contents
Nucleotide sequence data in FASTA format is available for download in compressed files. We provide assembled cDNA nucleotide sequences and cDNA sequences coding for products longer than 50 amino acid residues. Each file contains the sequences of all reconstructed cDNAs of each Eimeria species.
5.3. Aminoacid sequences. Back to table of contents
Protein sequence data in FASTA format is available for download in compressed files. We provide cDNA sequences product sequences longer than 50 amino acid residues. Each file contains the sequences of all reconstructed cDNAs of each Eimeria species.
6. Some known issues. Back to table of contents
There are many instances where FT/GFF3 annotations present the product name as a "hypothetical protein", but BLAST has found some low scoring hits that are in the borderline between biologically significant hits or just casual random findings. We adopted a conservative approach to designate product names. The product name was only assigned if the top scoring BLAST hit (against nr database) has fulfilled the following criteria: e-value lower than 10-6 and similarity of the alignment block higher than 55%.
We are aware that this is just a set of parameters and, as such, will eventually discard biologically significant alignments. Conversely, it will sometimes consider some poor alignments as significant. Also, assigning function based solely on BLAST results is obviously a very primitive strategy, but this was done just as a convenient quick and dirty automated approach. It is up to the user to inspect all analysis results, available in an easy to inspect interface, download the FT file and then edit it on Artemis. This manual curation is the key for a reliable annotation.
The same way as we only assigned a product name for sequences that produced alignments fulfilling the aforementioned criteria, the annotation tables (see section 3.2.) also follow this strategy. Thus, the evidence tables may sometimes present BLAST results as "no hits" links. However, by clicking on these links, the user may find BLAST results presenting some low scoring alignments. These alignments have been considered as nonspecific according to the criteria described above. It is up to the user, upon visual inspection, to decide whether or not these alignments should be considered relevant.
Profs. Arthur Gruber and Alda Maria B.N. Madeira established the Coccidia Molecular Biology Research Group in 1996 at the University of São Paulo. Formerly located at the Veterinary Medicine School, the group has moved in 2006 to the Department of Parasitology of the Institute of Biomedical Sciences.
Our group has focused on two main research lines:
Molecular biology of Eimeria
Development of Bioinformatics tools
Project coordinators
Collaborator
Current and past students
Eimeria and coccidiosis
Coccidiosis of the domestic fowl is a worldwide disease caused by seven species of protozoan parasites of the genus Eimeria. Parasites are highly host-specific, present a monoxenous life cycle, and are transmitted via the oral-fecal route. High host population densities, associated with continuous physical contact of fecal droppings, are directly involved with the high morbidity of the disease. Mortality is in general relatively low, unless other secondary agents such as Clostridium are present. Eimeria parasites colonize intestinal cells and may lead to massive epithelium destruction. As a consequence, host may present diarrhea and malabsorption, with a decrease of weight gain. Chicken coccidiosis is a major cause of economical losses in broiler chicken production, due to direct effects such as poor feed conversion, or due to the indirect costs associated with control measures such the preventive use of anticoccidial drugs and/or vaccines. A comprehensive set of information on coccidiosis is available at DISCONTOOLS project site.
The genome and transcriptome
Eimeria tenella, the most widely studied species, presents a genome complexity of around 55-60 MB distributed in 14 chromosomes, with an estimated GC content of 53% . A whole genome sequence is available at the Sanger Institute, and the sequence of chromosome 1 has been published. The transcriptome of E. tenella is estimated in circa 8,000 genes.
The Coccidia Molecular Biology Research group has played a major role in sequencing cDNA from the three most relevant chicken Eimeria species: E. acervulina, E. maxima and E. tenella. In total, we have generated more than 45,000 ORESTES reads, which represented until 2011 the world’ s largest contribution of cDNA sequences of the genus Eimeria.
In addition to sequencing data, the Eimeria Transcript DB provides an organized catalogue of functionally annotated reconstructed transcripts. In the case of E. tenella, our group has analyzed locally generated data together with third party data available on public repositories, to provide an integrated source of information.
The Eimeria Transcript Database is maintained by the Coccidia Molecular Biology Research Group at the Institute of Biomedical Sciences at the University of São Paulo, Brazil.
The main goals of this repository are:
Funding
The Eimeria Transcript Database has been developed with support from FAPESP (São Paulo Research Foundation) and CNPq (National Council for Scientific and Technological Development). The opinions, hypotheses, and conclusions or recommendations present in this website are the sole responsibility of its authors and do not necessarily reflect the views of FAPESP and/or CNPq.
|
The Eimeria Transcript DB
v 1.1 - March 2012 ©2011 A. Gruber & A.M.B.N Madeira Laboratory of Molecular Biology of Coccidia
Department of Parasitology, Institute of Biomedical Sciences, USP Av. Prof. Lineu Prestes, 1374, São Paulo SP, Brazil, 05508-000 |